
Economy & Markets · April 30, 2026
U.S. Debt and Stock Market Valuations: Comparing 1929, 1999, 2007, and Today
How valuations and debt stack up at three critical moments: the dot-com peak, the 2007 housing bubble, and now.
The Buffett Indicator
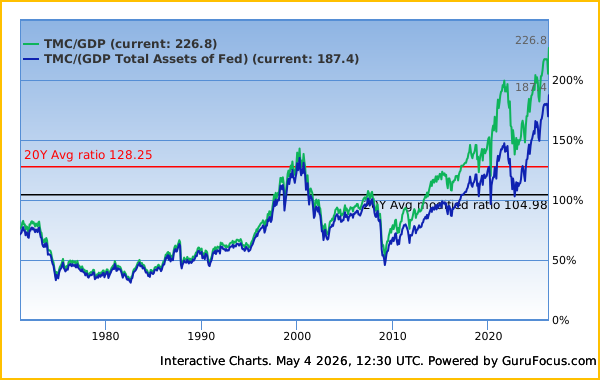
The Buffett Indicator compares the total value of the U.S. stock market to GDP: how much the financial markets are valued relative to the actual output of the economy. Warren Buffett described it as "probably the best single measure of where valuations stand at any given moment."
At the dot-com peak in 1999, it reached 159%. At the peak in 2007 it stood at 118%. Today it stands at 223.6%, the highest ever recorded.
Source: LongtermTrends.net · GuruFocus · April 27, 2026
Warren Buffett's Own Position
Berkshire Hathaway has been a net seller of stocks for 13 consecutive quarters as of early 2026, holding a record $382–392 billion in cash.
GuruFocus estimates that from current valuation levels, U.S. stocks are likely to return approximately –0.5% annualized over the next eight years.
Debt Fueled Housing. Now Stock Bubble.
From 1999 to 2007, household debt almost doubled from 49% to 98% of GDP, up 100%. During the same time, the Case-Shiller Home Price Index rose 84%.1 Government and corporate debt barely changed. The bubble was fueled by bank lending, and the ability to package and sell those loans, transferring the risk to investors.
Since 2007, U.S. government debt has doubled from 62% to 126% of GDP. Corporate debt has grown from 45% to 71%. Companies have used some of this debt to buy back stock. S&P 500 companies bought back a record $942.5 billion in 2024, directly raising share prices. Together, government and corporate debt have grown 84% since 2007, nearly matching the Buffett Indicator's 89% rise to 223.6%.
1 Case-Shiller National Home Price Index, FRED, Federal Reserve Bank of St. Louis
“The Wilshire 5000-to-GDP ratio just hit 226% — a record. We are trading at double the long-run average and 80% above the level that preceded the dot-com collapse. The gap between equity prices and economic output has never been wider in 50+ years of data. History doesn’t guarantee a crash. But it does suggest preparation isn’t optional.”
MutualFunds.com, May 2026Corporations Kept More, so Government Borrowed.
Government deficits have grown in part because corporate tax rates have fallen from 48% in the 1970s to 21% today, with corporate taxes as a share of GDP dropping from roughly 4% in the 1960s to 2% now.
The tax cuts were only part of it. Labor's share of GDP peaked at around 64% in the early 1970s and has fallen to around 57% today, a shift of roughly $2.07 trillion per year from wages to capital, according to BLS data. That reduction is similar in scale to today's federal deficit of $1.9 trillion, though not directly linked.
As wage growth weakened relative to GDP, transfer payments and deficits expanded, partially offsetting the gap. In doing so, they subsidized some of the shift from wages to capital, a shift that has also benefited millions through lower consumer prices, jobs tied to globalization, and rising asset values.
Labor's Share of Output Hits Record Low

Debt Is Money
In a monetary system like ours, money is created as debt through bank lending. When a bank issues a loan, it creates a deposit for the amount of the loan. That is new money. When that loan is paid back, that money is removed from circulation.
Banks do not wait for deposits before making loans. They mark up a digital ledger. The new entry on the bank's books is simultaneously money in the borrower's account. A bank's assets are its loans. Its liabilities are depositors' accounts. If all bank loans were paid off tomorrow, deposits would vanish and the money supply would collapse. Only physical currency, a fraction of what exists today, would remain.
This is why reducing debt is so difficult. As debt is paid down, the money supply contracts, spending falls, and economic activity slows. In 1929, bank failures wiped out deposits and collapsed the money supply by a third. The result was 25% unemployment and a 46% drop in GDP.
Government debt is the one exception: paying off government bonds does not destroy money; it simply transfers money to the bondholders. However, unless taxes are raised only on the wealthy and transfer payments to the middle and lower classes are maintained, reducing the government's debt means the middle class is subsidizing wealthy bondholders, foreign governments, and institutions. Meanwhile, the wealthiest Americans, who have already shifted to equities, face higher taxes and possibly lower stock prices.
US Debt by Sector as % of GDP
| Sector | 1999 | 2007 | May 2026 |
|---|---|---|---|
| Federal Debt / GDP | 58% | 62% | 126% |
| Corporate & Business Debt / GDP | 44% | 45% | 71% |
| Household Debt / GDP | 49% | 98% | 61% |
| State & Local Debt / GDP | 8.7% | 12.3% | 11.7% |
Bold red = highest recorded level for that sector.
Why Inflation Does Not Reduce the Debt
Inflation can reduce the real burden of government debt, but it does little to resolve total system-wide leverage, especially private debt, which makes up the majority. The focus on inflation often serves to shift attention from the scale of the underlying debt problem.
Governments do not control inflation. Central banks do not control the money supply. They influence the price of credit. There is no lever that says inflate now. Debt across all sectors tripled in the 1980s and inflation fell. Nobody fully knows why.
But the deeper problem is that federal debt is one third of the story. Total nonfinancial debt (government, corporate, household) stands at 270% of GDP. Governments control only their slice. They cannot inflate away corporate debt or household debt. Those are private obligations between private parties.
And to grow the economy fast enough to outrun 270% of GDP in debt requires more borrowing, which adds to the debt. The ratio doesn't fall. It is being layered, not eroded.
Reagan Decade: Debt Was the Fuel
Ronald Reagan presided over the largest expansion of total U.S. debt of any post-WWII president. Government, corporate, and household debt combined grew 202% during the 1980s.
| Decade | Total Debt Start | Total Debt End | Debt % Increase | Avg GDP Growth |
|---|---|---|---|---|
| 1950–1960 | $406B | $763B | 88% | 4.2% |
| 1960–1970 | $763B | $1.5T | 103% | 4.5% |
| 1970–1980 | $1.5T | $4.5T | 189% | 3.3% |
| 1980–1990 (Reagan) | $4.5T | $13.6T | 202% | 3.1% |
| 1990–2000 | $13.6T | $27.3T | 101% | 3.2% |
| 2000–2010 | $27.3T | $54.1T | 98% | 1.9% |
| 2010–2020 | $54.1T | $77.2T | 43% | 2.2% |
Total debt grows every decade. No exceptions. No matter who is in the White House or what the ideology. The system requires it.
Who Holds the Wealth
Total U.S. household wealth as of early 2026 is approximately $160 trillion.
- Top 1%: 30% of household wealth, roughly $48 trillion
- Top 10%: 67%, roughly $107 trillion · own 93% of all equities
- Middle 40%: 27%, largely home equity and 401ks
- Bottom 50% own effectively no stocks and no bonds
The Fed's distributional data only goes back to 1989. Saez and Zucman estimate the top 1% wealth share increased 19 points over the 1978–2012 period. In 1978 the top 1% held 11% of household wealth. Today it is 30%.
The Dotcom Comparison
At the dot-com peak in 1999, the Buffett Indicator stood at 159%, roughly half its current level of 223.6%. The S&P 500 returned approximately -3% to -4% annualized over the following decade. During prolonged periods of muted or negative index returns, internal portfolio costs and annuity fees compound against you; auditing workplace holdings through an independent 403(b) and 457 fee review ensures unnecessary expense layers do not erode your capital.
Where the Numbers Stand
Key Indicators: April 30, 2026
- Total U.S. debt all sectors: $107.6 trillion
- Total liabilities including banks / GDP: 719.3% (Source: CEIC)
- Buffett Indicator: 223.6%, All-time record
- Federal debt: $39.06 trillion, growing $7.58 billion per day
- Corporate & business debt: $22.2 trillion
- Household debt: $20.9 trillion ($13.17T mortgages, $1.28T credit cards)
- Federal deficit 2026: $1.9 trillion (CBO projection)
- Berkshire Hathaway cash hoard: $382–392 billion, net seller of stocks 13 consecutive quarters